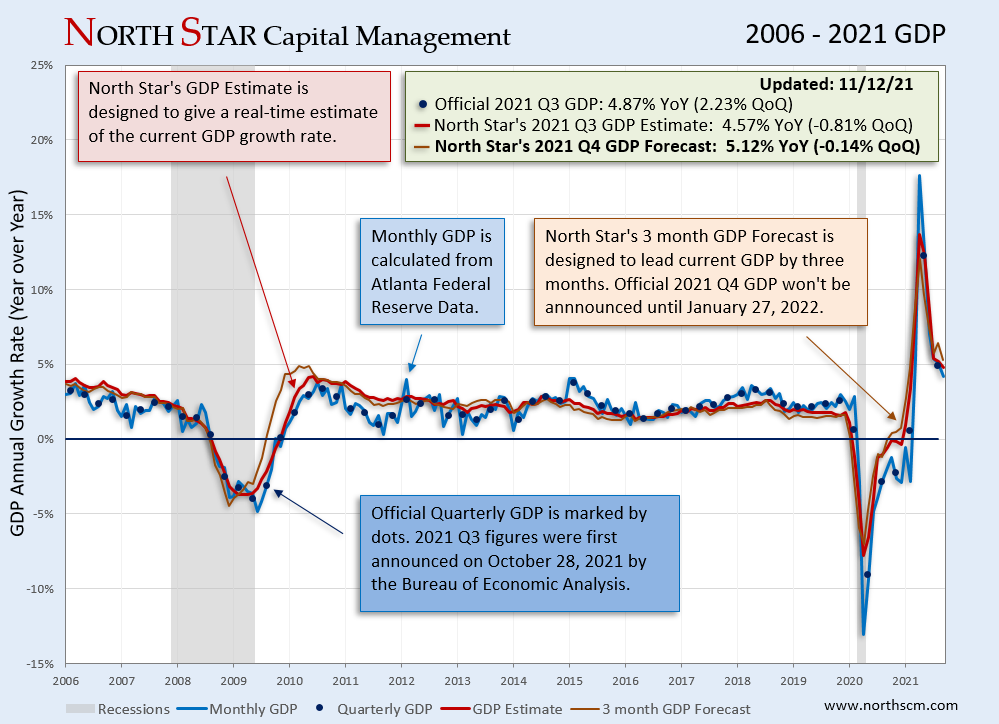
The North Star GDP Estimate for the third quarter is 4.57% year over year growth (-0.81% QoQ). The North Star GDP Forecast for the fourth quarter is at 5.12% year over year growth (-0.14% QoQ), down from 5.18% last week.. The
GDP Forecast page on the tab above is updated periodically during the week.
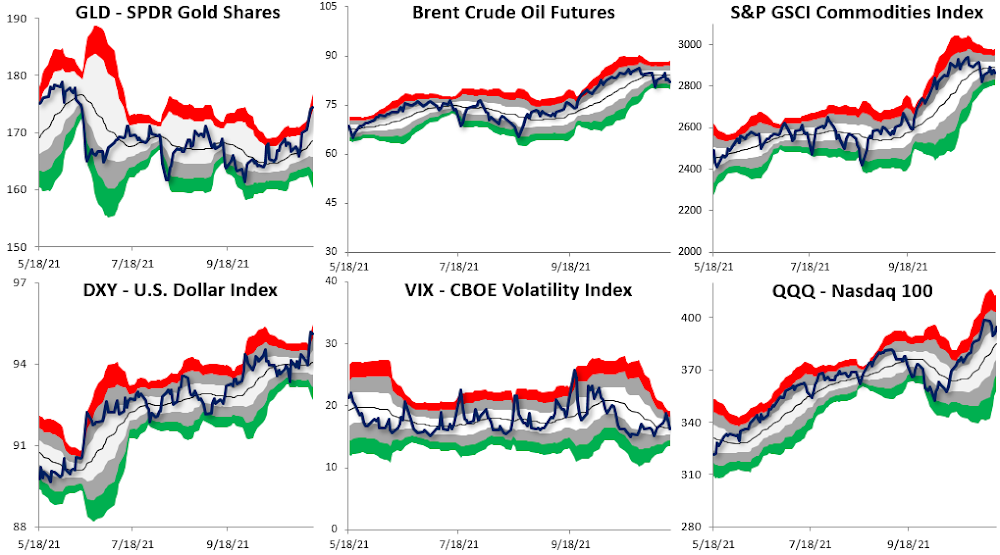
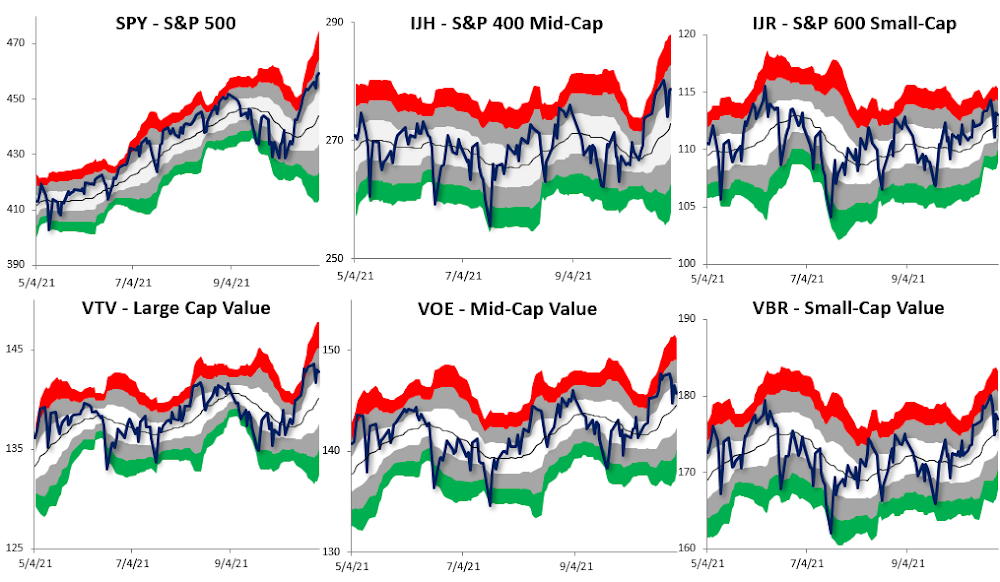
Stock and bond prices were down for the week. Inflation rose 6.2% year over year, the highest rate since 1990. The 5 year breakeven rate (the rate that the market expects inflation to average over the next 5 years) is at 3.11%. The red (or green) area indicates 2-3 standard deviations above (or below) the normal 21 day trading range. The gray area indicates 1-2 standard deviations above (or below) the normal 21 day trading range.
The Leading Indicator for International Developed Markets (EFA) decreased by 0.93% percentage points to 3.31%. The Leading Indicator for International Emerging Markets (EEM) is at 3.81%. On the chart below, you can click on the blue and red buttons to see the Leading Indicator growth rate and an ETF for each country.
All information, data and analysis provided by this website is for informational purposes only and is not a recommendation to buy or sell any security. Click here for more details.
These charts have limitations. Economic data is often revised after the fact. The market is forward looking and anticipates future events. The unexpected can and will happen. The market is continually changing. The conditions of the past are different from the present. Past performance is not an indication of future performance.