Sunday, December 29, 2013

Charting Last Week (12/23 - 12/27/13)

The Daily Leading Index fell by 0.10% percentage points to 7.12%. The Daily Coincident Index rose to 3.41%. The Daily Leading Index page on the tab above is updated daily during the week.
Equities posted gains for the week led by International Developed Markets (EFA). The S&P 500 pushed higher into record territory. Bond prices were down for the week as the yield on the 10 Year Treasury crossed the 3.00% mark. The charts below show the normal trading ranges for various indices for the last six months. The red (or green) area indicates 2-3 standard deviations above (or below) the normal 21 day trading range. The gray area indicates 1-2 standard deviations above (or below) the normal 21 day trading range.
The Leading Index for the International Developed Markets (EFA) fell by 0.26 percentage points to 4.54%. The Leading Index for International Emerging Markets (EEM) fell to 4.71%. On the chart below, you can click on the blue and red buttons to see the Leading Indicator growth rate and an ETF for each country.
All information, data and analysis provided by this website is for informational purposes only and is not a recommendation to buy or sell any security.   Click here for more details.

These charts have limitations.  Economic data is often revised after the fact.  The market is forward looking and anticipates future events.  The unexpected can and will happen.  The market is continually changing.  The conditions of the past are different from the present.  Past performance is not an indication of future performance.

Sunday, December 22, 2013

Charting Last Week (12/16 - 12/20/13)

The Daily Leading Index fell by 0.66% percentage points to 7.22%. The Daily Coincident Index is at 3.26%. The Daily Leading Index page on the tab above is updated daily during the week.
Equities were up for the week except for International Emerging Markets (EEM). The S&P 500 closed the week at a new record high. The announced that they would be tapering back their monthly asset purchases from $85 billion to $75 billion. Equities rallied on the news while Bond Prices didn't change much. The charts below show the normal trading ranges for various indices for the last six months. The red (or green) area indicates 2-3 standard deviations above (or below) the normal 21 day trading range. The gray area indicates 1-2 standard deviations above (or below) the normal 21 day trading range.
The Leading Index for the International Developed Markets (EFA) rose by 0.03 percentage points to 4.80%. The Leading Index for International Emerging Markets (EEM) rose to 4.82%. On the chart below, you can click on the blue and red buttons to see the Leading Indicator growth rate and an ETF for each country.
All information, data and analysis provided by this website is for informational purposes only and is not a recommendation to buy or sell any security.   Click here for more details.

These charts have limitations.  Economic data is often revised after the fact.  The market is forward looking and anticipates future events.  The unexpected can and will happen.  The market is continually changing.  The conditions of the past are different from the present.  Past performance is not an indication of future performance.

Sunday, December 15, 2013

Charting Last Week (12/9 - 12/13/13)

The Daily Leading Index rose by 0.16% percentage points to 7.88%. The Daily Coincident Index is at 2.83%. The Daily Leading Index page on the tab above is updated daily during the week.
Equities were down for the week, while bond prices were up. Equities have declined for two weeks in a row now. The charts below show the normal trading ranges for various indices for the last six months. The red (or green) area indicates 2-3 standard deviations above (or below) the normal 21 day trading range. The gray area indicates 1-2 standard deviations above (or below) the normal 21 day trading range.
The Leading Index for the International Developed Markets (EFA) rose by 0.16 percentage points to 4.77%. The Leading Index for International Emerging Markets (EEM) rose to 4.68%. The Leading Indices for EFA and EEM rose after the OECD monthly release. The Conference Board also release updates for the UK (increased slightly), Japan (decreased slightly), and South Korea (posted a strong increase). On the chart below, you can click on the blue and red buttons to see the Leading Indicator growth rate and an ETF for each country.
All information, data and analysis provided by this website is for informational purposes only and is not a recommendation to buy or sell any security.   Click here for more details.

These charts have limitations.  Economic data is often revised after the fact.  The market is forward looking and anticipates future events.  The unexpected can and will happen.  The market is continually changing.  The conditions of the past are different from the present.  Past performance is not an indication of future performance.

Saturday, December 14, 2013

International Leading Indicators - 12/09/13

The Leading Indicator for International Developed Markets (EFA) rose to 4.73% and is 0.48% percentage points higher than last month. The Leading Indicator for International Emerging Markets (EEM) rose to 4.36%. MSCI took Greece out of the Developed Markets Index and placed Greece in the Emerging Markets Index (EEM).

The OECD released their Leading Indicators for most major countries this week. When available, I have averaged the indicators with the Conference Board's Leading indicators to create a composite for each country. I created Leading Indicators for International Developed Markets (EFA) and International Emerging Markets (EEM) by weighting each country's growth rate by the market share of each country's stocks in the respective funds. On the last chart below, you can click on the blue and red buttons to see the Leading Indicator growth rate and an ETF for various countries.

All information, data and analysis provided by this website is for informational purposes only and is not a recommendation to buy or sell any security.   Click here for more details.

Furthermore, these charts have limitations.  Economic data is often revised after the fact.  The market is forward looking and anticipates future events.  The unexpected can and will happen.  The market is continually changing.  The conditions of the past are different from the present.  Past performance is not an indication of future performance.

Sunday, December 8, 2013

Charting Last Week (12/2 - 12/6/13)

The Daily Leading Index rose by 1.54% percentage points to 7.72% led by Consumer Sentiment which recovered after falling with the Government Shutdown. The Daily Coincident Index is at 2.83%. The Daily Leading Index page on the tab above is updated daily during the week.
Both equities and bond prices were down for the week. The S&P500 is within a few points of the record closing high set last week. The charts below show the normal trading ranges for various indices for the last six months. The red (or green) area indicates 2-3 standard deviations above (or below) the normal 21 day trading range. The gray area indicates 1-2 standard deviations above (or below) the normal 21 day trading range.
There were not any updates to the International Leading Indices during the week. The Leading Index for the International Developed Markets (EFA) is at 4.61%. The Leading Index for International Emerging Markets (EEM) is at 4.14%. On the chart below, you can click on the blue and red buttons to see the Leading Indicator growth rate and an ETF for each country.
All information, data and analysis provided by this website is for informational purposes only and is not a recommendation to buy or sell any security.   Click here for more details.

These charts have limitations.  Economic data is often revised after the fact.  The market is forward looking and anticipates future events.  The unexpected can and will happen.  The market is continually changing.  The conditions of the past are different from the present.  Past performance is not an indication of future performance.

Sunday, November 24, 2013

Charting Last Week (11/18 - 11/22/13)

The Daily Leading Index fell by 0.03% percentage points to 5.02%. The Daily Coincident Index is at 2.93%. U.S. GDP came in at 2.8% in the third quarter. Goldman Sachs is forecasting a 2.9% growth in GDP for 2014. The Daily Leading Index page on the tab above is updated daily during the week.
U.S. equities were up for the week while International equities fell. Bond prices were mixed for the week. The S&P500 is at a new all-time high at 1804. The charts below show the normal trading ranges for various indices for the last six months. The red (or green) area indicates 2-3 standard deviations above (or below) the normal 21 day trading range. The gray area indicates 1-2 standard deviations above (or below) the normal 21 day trading range.
The Leading Index for the International Developed Markets (EFA) rose by 0.02 percentage points to 4.40%. The Leading Index for International Emerging Markets (EEM) rose to 4.16%. On the chart below, you can click on the blue and red buttons to see the Leading Indicator growth rate and an ETF for each country.
All information, data and analysis provided by this website is for informational purposes only and is not a recommendation to buy or sell any security.   Click here for more details.

These charts have limitations.  Economic data is often revised after the fact.  The market is forward looking and anticipates future events.  The unexpected can and will happen.  The market is continually changing.  The conditions of the past are different from the present.  Past performance is not an indication of future performance.

Saturday, November 16, 2013

Charting Last Week (11/11 - 11/15/13)

The Daily Leading Index fell by 0.01% percentage points to 5.05%. The Daily Coincident Index is at 2.93%. The Daily Leading Index page on the tab above is updated daily during the week.
Equities and Bond Prices were up across the board for the week. The S&P500 is at a new all-time high at 1798. The charts below show the normal trading ranges for various indices for the last six months. The red (or green) area indicates 2-3 standard deviations above (or below) the normal 21 day trading range. The gray area indicates 1-2 standard deviations above (or below) the normal 21 day trading range.
The Leading Index for the International Developed Markets (EFA) rose by 0.40 percentage points to 4.38%. The Leading Index for International Emerging Markets (EEM) rose to 4.20%. On the chart below, you can click on the blue and red buttons to see the Leading Indicator growth rate and an ETF for each country.
All information, data and analysis provided by this website is for informational purposes only and is not a recommendation to buy or sell any security.   Click here for more details.

These charts have limitations.  Economic data is often revised after the fact.  The market is forward looking and anticipates future events.  The unexpected can and will happen.  The market is continually changing.  The conditions of the past are different from the present.  Past performance is not an indication of future performance.

Wednesday, November 13, 2013

International Leading Indicators - 11/12/13

The Leading Indicator for International Developed Markets (EFA) rose to 4.25% and is 0.64% percentage points higher than last month. The Leading Indicator for International Emerging Markets (EEM) rose to 4.14%.

The OECD released their Leading Indicators for most major countries yesterday. When available, I have averaged the indicators with the Conference Board's Leading indicators to create a composite for each country. I created Leading Indicators for International Developed Markets (EFA) and International Emerging Markets (EEM) by weighting each country's growth rate by the market share of each country's stocks in the respective funds. On the last chart below, you can click on the blue and red buttons to see the Leading Indicator growth rate and an ETF for various countries.

All information, data and analysis provided by this website is for informational purposes only and is not a recommendation to buy or sell any security.   Click here for more details.

Furthermore, these charts have limitations.  Economic data is often revised after the fact.  The market is forward looking and anticipates future events.  The unexpected can and will happen.  The market is continually changing.  The conditions of the past are different from the present.  Past performance is not an indication of future performance.

Sunday, November 10, 2013

Charting Last Week (11/04 - 11/8/13)

The Daily Leading Index rose by 0.28% percentage points to 5.06%. The Daily Coincident Index is at 3.07%. The Daily Leading Index page on the tab above is updated daily during the week.
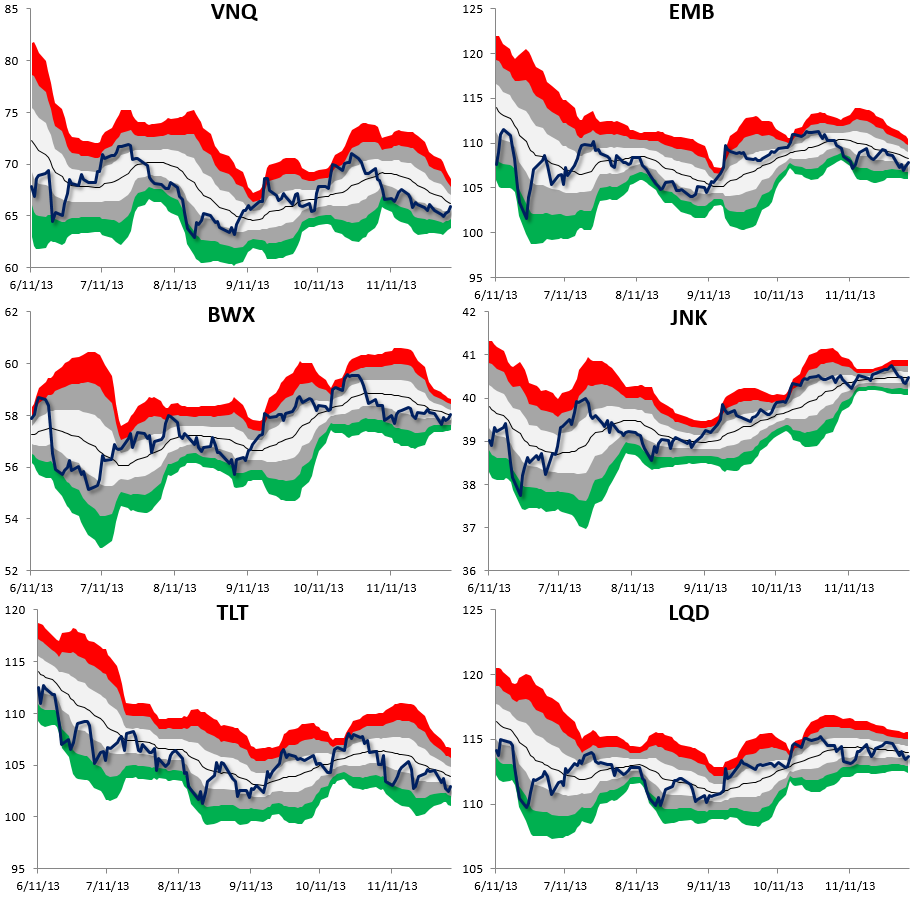
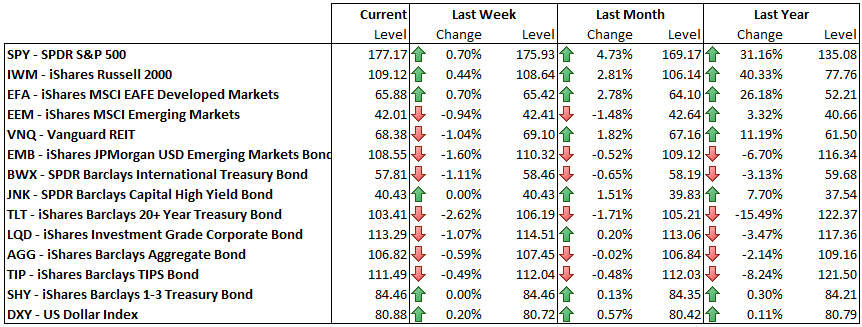
Over the last three weeks, there seems to be a flight to quality and a shift away from riskier equity classes. Month over Month, the S&P 500 (SPY) has risen by 4.73% while the Russell 2000 (IWM) is up by 2.81%. Over the same time frame, International Developed Markets (EFA) rose by 2.78%, while International Emerging Markets (EEM) fell by 1.48%. Long Term Treasuries (TLT) were down 2.62% for the week and are now in the oversold territory. The charts below show the normal trading ranges for various indices for the last six months. The red (or green) area indicates 2-3 standard deviations above (or below) the normal 21 day trading range. The gray area indicates 1-2 standard deviations above (or below) the normal 21 day trading range.
There were not any updates to the International Leading Indices during the week. The Leading Index for the International Developed Markets (EFA) is at 3.98%. The Leading Index for International Emerging Markets (EEM) is at 4.00%. On the chart below, you can click on the blue and red buttons to see the Leading Indicator growth rate and an ETF for each country.
All information, data and analysis provided by this website is for informational purposes only and is not a recommendation to buy or sell any security.   Click here for more details.

These charts have limitations.  Economic data is often revised after the fact.  The market is forward looking and anticipates future events.  The unexpected can and will happen.  The market is continually changing.  The conditions of the past are different from the present.  Past performance is not an indication of future performance.

Sunday, November 3, 2013

Charting Last Week (10/28 - 11/1/13)

The Daily Leading Index fell by 0.48% percentage points to 4.78%. The Daily Coincident Index is at 2.84%. The Daily Leading Index page on the tab above is updated daily during the week.
Equities and Bond Prices fell for the week with the exception of the S&P 500, which pushed farther into record territory earlier in the week. The charts below show the normal trading ranges for various indices for the last six months. The red (or green) area indicates 2-3 standard deviations above (or below) the normal 21 day trading range. The gray area indicates 1-2 standard deviations above (or below) the normal 21 day trading range.
The Leading Index for the International Developed Markets (EFA) rose by 0.19 percentage points to 3.98%. The Leading Index for International Emerging Markets (EEM) rose to 4.00%. On the chart below, you can click on the blue and red buttons to see the Leading Indicator growth rate and an ETF for each country.
All information, data and analysis provided by this website is for informational purposes only and is not a recommendation to buy or sell any security.   Click here for more details.

These charts have limitations.  Economic data is often revised after the fact.  The market is forward looking and anticipates future events.  The unexpected can and will happen.  The market is continually changing.  The conditions of the past are different from the present.  Past performance is not an indication of future performance.