Sunday, December 28, 2014

Charting Last Week (12/22 - 12/26/14)

The Daily Leading Index decreased by 0.15% percentage points to 7.72%. The Daily Coincident Index increased to 4.60%. The Daily Leading Index page on the tab above is updated daily during the week.
Stock prices continued to rebound after being in the oversold territory two weeks ago. Bond prices were mostly down for the week. The charts below show the normal trading ranges for various indices for the last six months. The red (or green) area indicates 2-3 standard deviations above (or below) the normal 21 day trading range. The gray area indicates 1-2 standard deviations above (or below) the normal 21 day trading range.
The Leading Indicator for International Developed Markets (EFA) increased by 0.02% percentage points to 0.57%. The Leading Indicator for International Emerging Markets (EEM) is at 4.24%. On the chart below, you can click on the blue and red buttons to see the Leading Indicator growth rate and an ETF for each country.
All information, data and analysis provided by this website is for informational purposes only and is not a recommendation to buy or sell any security.   Click here for more details.

These charts have limitations.  Economic data is often revised after the fact.  The market is forward looking and anticipates future events.  The unexpected can and will happen.  The market is continually changing.  The conditions of the past are different from the present.  Past performance is not an indication of future performance.

Sunday, December 21, 2014

Charting Last Week (12/15 - 12/19/14)

The Daily Leading Index decreased by 0.89% percentage points to 7.87%. The Daily Coincident Index increased to 4.21%. The Daily Leading Index page on the tab above is updated daily during the week.
Stock prices rebounded sharply after being in the oversold territory. Bond prices were mixed for the week. The charts below show the normal trading ranges for various indices for the last six months. The red (or green) area indicates 2-3 standard deviations above (or below) the normal 21 day trading range. The gray area indicates 1-2 standard deviations above (or below) the normal 21 day trading range.
The Leading Indicator for International Developed Markets (EFA) decreased by 0.03% percentage points to 0.56%. The Leading Indicator for International Emerging Markets (EEM) is at 4.72%. On the chart below, you can click on the blue and red buttons to see the Leading Indicator growth rate and an ETF for each country.
All information, data and analysis provided by this website is for informational purposes only and is not a recommendation to buy or sell any security.   Click here for more details.

These charts have limitations.  Economic data is often revised after the fact.  The market is forward looking and anticipates future events.  The unexpected can and will happen.  The market is continually changing.  The conditions of the past are different from the present.  Past performance is not an indication of future performance.

Sunday, December 14, 2014

Charting Last Week (12/8 - 12/12/14)

The Daily Leading Index increased by 0.69% percentage points to 8.75%. The Daily Coincident Index is at 3.67%. The Daily Leading Index page on the tab above is updated daily during the week.
Stock prices were down sharply for the week and are in the oversold territory now.  Just one week ago, the S&P 500 was at its all-time high.   Bond prices were mostly up for the week. The charts below show the normal trading ranges for various indices for the last six months. The red (or green) area indicates 2-3 standard deviations above (or below) the normal 21 day trading range. The gray area indicates 1-2 standard deviations above (or below) the normal 21 day trading range.
The Leading Indicator for International Developed Markets (EFA) rose by 0.25% percentage points to 0.58% after declining steadily for ten months. The Leading Indicator for International Emerging Markets (EEM) is at 4.76%. On the chart below, you can click on the blue and red buttons to see the Leading Indicator growth rate and an ETF for each country.
All information, data and analysis provided by this website is for informational purposes only and is not a recommendation to buy or sell any security.   Click here for more details.

These charts have limitations.  Economic data is often revised after the fact.  The market is forward looking and anticipates future events.  The unexpected can and will happen.  The market is continually changing.  The conditions of the past are different from the present.  Past performance is not an indication of future performance.

Tuesday, December 9, 2014

International Leading Indicators - 12/8/14

The Leading Indicator for International Developed Markets (EFA) fell to 0.34% and is 0.13% percentage points lower than last month continuing its steady ten month slide. The Leading Indicator for International Emerging Markets (EEM) rose to 4.77%.

The OECD released their Leading Indicators for most major countries today. 10 of the 20 countries in the Developed Markets had declining Leading Indices. The Leading Indices declined for 10 out of 15 countries in the Emerging Markets. When available, I have averaged the indicators with the Conference Board's Leading indicators to create a composite for each country. I created Leading Indicators for International Developed Markets (EFA) and International Emerging Markets (EEM) by weighting each country's growth rate by the market share of each country's stocks in the respective funds. On the last chart below, you can click on the blue and red buttons to see the Leading Indicator growth rate and an ETF for various countries.

All information, data and analysis provided by this website is for informational purposes only and is not a recommendation to buy or sell any security.   Click here for more details.

Furthermore, these charts have limitations.  Economic data is often revised after the fact.  The market is forward looking and anticipates future events.  The unexpected can and will happen.  The market is continually changing.  The conditions of the past are different from the present.  Past performance is not an indication of future performance.

Sunday, December 7, 2014

Charting Last Week (12/1 - 12/5/14)

The Daily Leading Index increased by 0.67% percentage points to 8.06%. The Daily Coincident Index is at 3.67%. The Daily Leading Index page on the tab above is updated daily during the week.
U.S. stock prices were up for the week and the S&P 500 closed at a new high. Bond prices were down for the week. The charts below show the normal trading ranges for various indices for the last six months. The red (or green) area indicates 2-3 standard deviations above (or below) the normal 21 day trading range. The gray area indicates 1-2 standard deviations above (or below) the normal 21 day trading range.
There were not any updates to the International Leading Indices during the week. The Leading Indicator for International Developed Markets (EFA) is at 0.29%. The Leading Indicator for International Emerging Markets (EEM) is at 4.88%. On the chart below, you can click on the blue and red buttons to see the Leading Indicator growth rate and an ETF for each country.
All information, data and analysis provided by this website is for informational purposes only and is not a recommendation to buy or sell any security.   Click here for more details.

These charts have limitations.  Economic data is often revised after the fact.  The market is forward looking and anticipates future events.  The unexpected can and will happen.  The market is continually changing.  The conditions of the past are different from the present.  Past performance is not an indication of future performance.

Sunday, November 30, 2014

Charting Last Week (11/24 - 11/28/14)

The Daily Leading Index decreased by 0.29% percentage points to 7.39%. The Daily Coincident Index is at 3.53%. The Daily Leading Index page on the tab above is updated daily during the week.
Stock prices were mostly up for the week as the S&P 500 closed at a new weekly high. Bond prices were mostly up for the week. The charts below show the normal trading ranges for various indices for the last six months. The red (or green) area indicates 2-3 standard deviations above (or below) the normal 21 day trading range. The gray area indicates 1-2 standard deviations above (or below) the normal 21 day trading range.
The Leading Indicator for International Developed Markets (EFA) declined by 0.47% percentage points to 0.29%. The Leading Indicator for International Emerging Markets (EEM) is at 4.88%.


All information, data and analysis provided by this website is for informational purposes only and is not a recommendation to buy or sell any security.   Click here for more details.

These charts have limitations.  Economic data is often revised after the fact.  The market is forward looking and anticipates future events.  The unexpected can and will happen.  The market is continually changing.  The conditions of the past are different from the present.  Past performance is not an indication of future performance.

Sunday, November 23, 2014

Charting Last Week (11/17 - 11/21/14)

The Daily Leading Index increased by 0.63% percentage points to 7.68%. The Daily Coincident Index is at 3.64%. The Daily Leading Index page on the tab above is updated daily during the week.
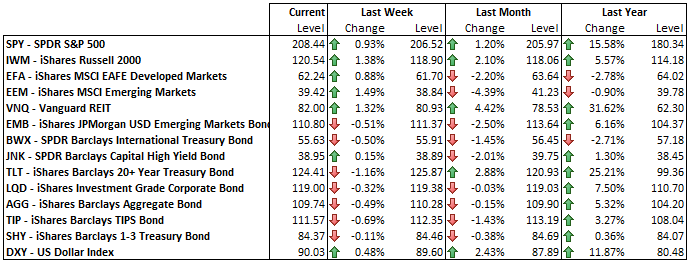
Stock prices were mostly up for the week as the S&P 500 closed at a new high. International Emerging Markets (EEM) rose sharply by 3.2% on Friday after China announced its first rate cut in two years. Bond prices were mostly up for the week. The charts below show the normal trading ranges for various indices for the last six months. The red (or green) area indicates 2-3 standard deviations above (or below) the normal 21 day trading range. The gray area indicates 1-2 standard deviations above (or below) the normal 21 day trading range.
Earnings Season for the S&P 500 is coming to a close. With 97% of the S&P 500 reporting earnings for last quarter, as reported full year earnings are on pace to be up 12.4% year over year. The Leading Indicator for International Developed Markets (EFA) declined by 0.04% percentage points to 0.42%. The Leading Indicator for International Emerging Markets (EEM) is at 4.46%.

 On Monday it was announced that Japan has slipped into yet another recession. This surprised most economists. According to the Wall Street Journal: "None of the 18 economists surveyed by The Wall Street Journal had forecast a contraction; the median forecast was for a 2.25% expansion." The leading indicator for Japan is negative for six months now.
All information, data and analysis provided by this website is for informational purposes only and is not a recommendation to buy or sell any security.   Click here for more details.

These charts have limitations.  Economic data is often revised after the fact.  The market is forward looking and anticipates future events.  The unexpected can and will happen.  The market is continually changing.  The conditions of the past are different from the present.  Past performance is not an indication of future performance.

Sunday, November 16, 2014

Charting Last Week (11/10 - 11/14/14)

The Daily Leading Index increased by 0.11% percentage points to 7.05%. The Daily Coincident Index is at 3.87%. The Daily Leading Index page on the tab above is updated daily during the week.
The S&P 500 inched forward to close the week at a yet another new high. Bond prices were mostly down for the week. The charts below show the normal trading ranges for various indices for the last six months. The red (or green) area indicates 2-3 standard deviations above (or below) the normal 21 day trading range. The gray area indicates 1-2 standard deviations above (or below) the normal 21 day trading range.
Earnings Season for the S&P 500 is coming to a close. With 94% of the S&P 500 reporting earnings for last quarter, as reported full year earnings are on pace to be up 12.8% year over year.

The Leading Indicator for International Developed Markets (EFA) fell to 0.47% and is 0.32% percentage points lower than last month continuing its steady nine month slide. The Leading Indicator for International Emerging Markets (EEM) rose to 4.43%. The OECD released their Leading Indicators for most major countries on Wednesday. 17 of the 20 countries in the Developed Markets had declining Leading Indices. The Leading Indices declined for 7 out of 15 countries in the Emerging Markets.
All information, data and analysis provided by this website is for informational purposes only and is not a recommendation to buy or sell any security.   Click here for more details.

These charts have limitations.  Economic data is often revised after the fact.  The market is forward looking and anticipates future events.  The unexpected can and will happen.  The market is continually changing.  The conditions of the past are different from the present.  Past performance is not an indication of future performance.

Wednesday, November 12, 2014

International Leading Indicators - 11/12/14

The Leading Indicator for International Developed Markets (EFA) fell to 0.47% and is 0.32% percentage points lower than last month continuing its steady nine month slide. The Leading Indicator for International Emerging Markets (EEM) rose to 4.43%.

The OECD released their Leading Indicators for most major countries today. 17 of the 20 countries in the Developed Markets had declining Leading Indices. The Leading Indices declined for 7 out of 15 countries in the Emerging Markets. When available, I have averaged the indicators with the Conference Board's Leading indicators to create a composite for each country. I created Leading Indicators for International Developed Markets (EFA) and International Emerging Markets (EEM) by weighting each country's growth rate by the market share of each country's stocks in the respective funds. On the last chart below, you can click on the blue and red buttons to see the Leading Indicator growth rate and an ETF for various countries.

All information, data and analysis provided by this website is for informational purposes only and is not a recommendation to buy or sell any security.   Click here for more details.

Furthermore, these charts have limitations.  Economic data is often revised after the fact.  The market is forward looking and anticipates future events.  The unexpected can and will happen.  The market is continually changing.  The conditions of the past are different from the present.  Past performance is not an indication of future performance.

Sunday, November 9, 2014

Charting Last Week (11/3 - 11/7/14)

The Daily Leading Index decreased by 0.05% percentage points to 6.94%. The Daily Coincident Index is at 3.87%. The Daily Leading Index page on the tab above is updated daily during the week.
The S&P 500 closed the week at a yet another new high. International equities were down for the week led by International Emerging Markets (EEM) which were down 2.21% for the week. The charts below show the normal trading ranges for various indices for the last six months. The red (or green) area indicates 2-3 standard deviations above (or below) the normal 21 day trading range. The gray area indicates 1-2 standard deviations above (or below) the normal 21 day trading range.
Earnings Season for the S&P 500 is coming to a close. With 90% of the S&P 500 reporting earnings for last quarter, As Reported full year earnings are on pace to be up 13.1% year over year.

 The Leading Indicator for International Developed Markets (EFA) rose by 0.04% percentage points to 0.57%. The Leading Indicator for International Emerging Markets (EEM) is at 4.20%. On the chart below, you can click on the blue and red buttons to see the Leading Indicator growth rate and an ETF for each country.
All information, data and analysis provided by this website is for informational purposes only and is not a recommendation to buy or sell any security.   Click here for more details.

These charts have limitations.  Economic data is often revised after the fact.  The market is forward looking and anticipates future events.  The unexpected can and will happen.  The market is continually changing.  The conditions of the past are different from the present.  Past performance is not an indication of future performance.