Sunday, January 26, 2014

Charting Last Week (1/21 - 1/24/14)

The Daily Leading Index rose by 0.20% percentage points to 6.36%. The Daily Coincident Index is at 3.39%. The Daily Leading Index page on the tab above is updated daily during the week.
Equities fell sharply for the week led by International Emerging Markets (EEM) which was down 3.90% for the week. Bond prices were mixed. Long Term Treasuries (TLT) were up 1.90%. The 10 Year Treasury is at 2.72% after beginning the year above 3%. The charts below show the normal trading ranges for various indices for the last six months. The red (or green) area indicates 2-3 standard deviations above (or below) the normal 21 day trading range. The gray area indicates 1-2 standard deviations above (or below) the normal 21 day trading range.
The Leading Index for the International Developed Markets (EFA) remained at 4.49% as weakness in France offset strength in Germany. The Leading Index for International Emerging Markets (EEM) fell to 4.34%. On the chart below, you can click on the blue and red buttons to see the Leading Indicator growth rate and an ETF for each country.
All information, data and analysis provided by this website is for informational purposes only and is not a recommendation to buy or sell any security.   Click here for more details.

These charts have limitations.  Economic data is often revised after the fact.  The market is forward looking and anticipates future events.  The unexpected can and will happen.  The market is continually changing.  The conditions of the past are different from the present.  Past performance is not an indication of future performance.

Monday, January 20, 2014

Charting Last Week (1/13 - 1/17/14)

The Daily Leading Index fell by 0.44% percentage points to 6.16%. The Daily Coincident Index rose to 3.39%. The Daily Leading Index page on the tab above is updated daily during the week.
Equities were mixed for the week while Bond Prices were mostly up. The S&P 500 was down slightly for the week after posting a new record high on Wednesday. The charts below show the normal trading ranges for various indices for the last six months. The red (or green) area indicates 2-3 standard deviations above (or below) the normal 21 day trading range. The gray area indicates 1-2 standard deviations above (or below) the normal 21 day trading range.
The Leading Index for the International Developed Markets (EFA) fell by 0.04 percentage points to 4.49%. The Leading Index for International Emerging Markets (EEM) fell to 4.46%. On the chart below, you can click on the blue and red buttons to see the Leading Indicator growth rate and an ETF for each country.
All information, data and analysis provided by this website is for informational purposes only and is not a recommendation to buy or sell any security.   Click here for more details.

These charts have limitations.  Economic data is often revised after the fact.  The market is forward looking and anticipates future events.  The unexpected can and will happen.  The market is continually changing.  The conditions of the past are different from the present.  Past performance is not an indication of future performance.

Friday, January 17, 2014

International Leading Indicators - 1/13/14

The Leading Indicator for International Developed Markets (EFA) fell to 4.49% and is 0.32% percentage points lower than last month. The Leading Indicator for International Emerging Markets (EEM) is at 4.36%. 

The OECD released their Leading Indicators for most major countries this week. When available, I have averaged the indicators with the Conference Board's Leading indicators to create a composite for each country. I created Leading Indicators for International Developed Markets (EFA) and International Emerging Markets (EEM) by weighting each country's growth rate by the market share of each country's stocks in the respective funds. On the last chart below, you can click on the blue and red buttons to see the Leading Indicator growth rate and an ETF for various countries.

All information, data and analysis provided by this website is for informational purposes only and is not a recommendation to buy or sell any security.   Click here for more details.

Furthermore, these charts have limitations.  Economic data is often revised after the fact.  The market is forward looking and anticipates future events.  The unexpected can and will happen.  The market is continually changing.  The conditions of the past are different from the present.  Past performance is not an indication of future performance.

Sunday, January 12, 2014

Charting Last Week (1/6 - 1/10/14)

The Daily Leading Index fell by 0.12% percentage points to 6.60%. The Daily Coincident Index fell to 3.32%. The Daily Leading Index page on the tab above is updated daily during the week.
Equities and Bond Prices rose for the week led by Long Term Treasuries (TLT) which were up 2.19%. The 10 Year Treasury is at 2.86% after closing 2013 at 3.03%. The charts below show the normal trading ranges for various indices for the last six months. The red (or green) area indicates 2-3 standard deviations above (or below) the normal 21 day trading range. The gray area indicates 1-2 standard deviations above (or below) the normal 21 day trading range.
The Leading Index for the International Developed Markets (EFA) fell by 0.01 percentage points to 4.53% after Japan's Leading Index fell slightly to 5.54%. The Leading Index for International Emerging Markets (EEM) is at 4.71%. On the chart below, you can click on the blue and red buttons to see the Leading Indicator growth rate and an ETF for each country.
All information, data and analysis provided by this website is for informational purposes only and is not a recommendation to buy or sell any security.   Click here for more details.

These charts have limitations.  Economic data is often revised after the fact.  The market is forward looking and anticipates future events.  The unexpected can and will happen.  The market is continually changing.  The conditions of the past are different from the present.  Past performance is not an indication of future performance.

Sunday, January 5, 2014

Charting Last Week (12/30 - 1/3/14)

The Daily Leading Index fell by 0.39% percentage points to 6.73%. The Daily Coincident Index is at 3.41%. The Daily Leading Index page on the tab above is updated daily during the week.
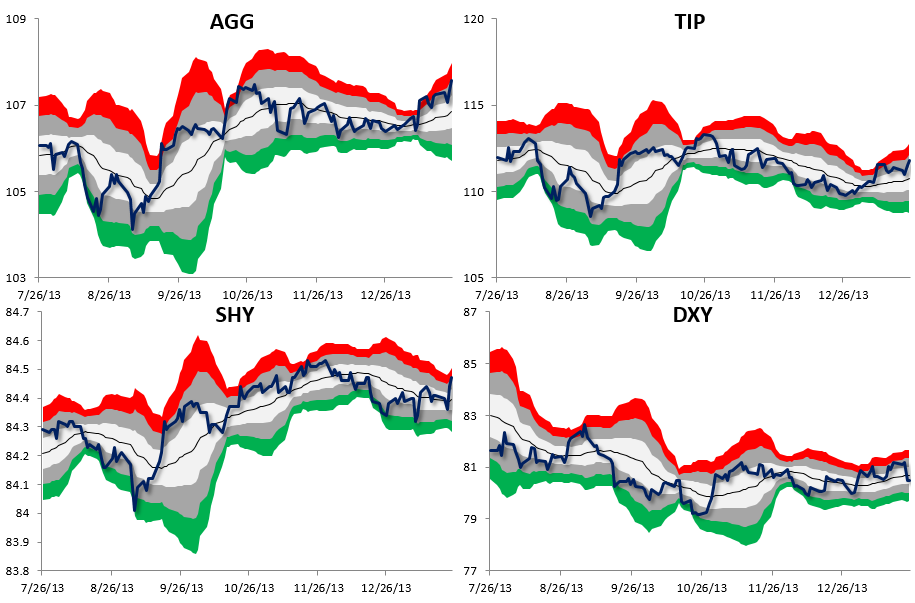
Equities fell for the week while U.S. Bond Prices rose. The S&P 500 (SPY) finished the year with a 32.31% gain. Equities were led by the Russell 2000 (IWM) with a 38.70% gain for the year. International Developed Markets (EFA) were up 21.45% for the year while International Emerging Markets were down 3.64% for the year. Most Bond Prices were down for the year. The charts below shows data as of Friday's close except for the 2013 columns on the first chart on the right which shows the performance for the full 2013 year. The charts below show the normal trading ranges for various indices for the last six months. The red (or green) area indicates 2-3 standard deviations above (or below) the normal 21 day trading range. The gray area indicates 1-2 standard deviations above (or below) the normal 21 day trading range.
There were not any updates to the International Leading Indices during the week. The Leading Index for the International Developed Markets (EFA) is at 4.54%. The Leading Index for International Emerging Markets (EEM) is at 4.71%. On the chart below, you can click on the blue and red buttons to see the Leading Indicator growth rate and an ETF for each country.
All information, data and analysis provided by this website is for informational purposes only and is not a recommendation to buy or sell any security.   Click here for more details.

These charts have limitations.  Economic data is often revised after the fact.  The market is forward looking and anticipates future events.  The unexpected can and will happen.  The market is continually changing.  The conditions of the past are different from the present.  Past performance is not an indication of future performance.