Sunday, February 28, 2016

Charting Last Week (2/22 - 2/26/16)

The Daily Leading Index increased by 1.34% percentage points to 1.67%. The Daily Coincident Index is at 2.74%. The Daily Leading Index page on the tab above is updated daily during the week.
Stock prices were mostly up for the week while bond prices were mixed. Core CPI is up to 2.2% over last year after being below 2% for most of the last three years. The Fed Funds futures market is now pricing in a 57% chance of a rate hike by December after not expecting a rate hike until after February of next year. The charts below show the normal trading ranges for various indices for the last six months. I have updated the charts to include all of the asset classes that I track. The red (or green) area indicates 2-3 standard deviations above (or below) the normal 21 day trading range. The gray area indicates 1-2 standard deviations above (or below) the normal 21 day trading range.
The Leading Indicator for International Developed Markets (EFA) decreased by 0.09% percentage points to 1.09%. The Leading Indicator for International Emerging Markets (EEM) is at 3.09%. On the chart below, you can click on the blue and red buttons to see the Leading Indicator growth rate and an ETF for each country.
All information, data and analysis provided by this website is for informational purposes only and is not a recommendation to buy or sell any security.   Click here for more details.

These charts have limitations.  Economic data is often revised after the fact.  The market is forward looking and anticipates future events.  The unexpected can and will happen.  The market is continually changing.  The conditions of the past are different from the present.  Past performance is not an indication of future performance.

Sunday, February 21, 2016

Charting Last Week (2/16 - 2/19/16)

The Daily Leading Index decreased by 0.01% percentage points to 0.33%. The Daily Coincident Index is at 2.76%. The Daily Leading Index page on the tab above is updated daily during the week.
The S&P 500 (SPY) posted a strong 2.88% gain for the week as equities continued to rebound. Bond prices were mixed for the week. The charts below show the normal trading ranges for various indices for the last six months. I have updated the charts to include all of the asset classes that I track. The red (or green) area indicates 2-3 standard deviations above (or below) the normal 21 day trading range. The gray area indicates 1-2 standard deviations above (or below) the normal 21 day trading range.
The Leading Indicator for International Developed Markets (EFA) increased by 0.08% percentage points to 1.19%. The Leading Indicator for International Emerging Markets (EEM) is at 3.14%. On the chart below, you can click on the blue and red buttons to see the Leading Indicator growth rate and an ETF for each country.
All information, data and analysis provided by this website is for informational purposes only and is not a recommendation to buy or sell any security.   Click here for more details.

These charts have limitations.  Economic data is often revised after the fact.  The market is forward looking and anticipates future events.  The unexpected can and will happen.  The market is continually changing.  The conditions of the past are different from the present.  Past performance is not an indication of future performance.

Sunday, February 14, 2016

Charting Last Week (2/8 - 2/12/16)

The Daily Leading Index decreased by 0.40% percentage points to 0.34%. The Daily Coincident Index is at 2.37%. The Daily Leading Index page on the tab above is updated daily during the week.
Stocks rebounded on Friday ending the week slightly down for the week. Bond prices were mostly up with the yield on the 10 year Treasury falling to 1.75%. When the Fed raised rates in December of 2015, they were forecasting rates rising by 1% in 2016 implying 4 rate hikes of 0.25%. The Fed Funds futures are currently implying no rate hikes through February 2017 according to data from CME Group's 
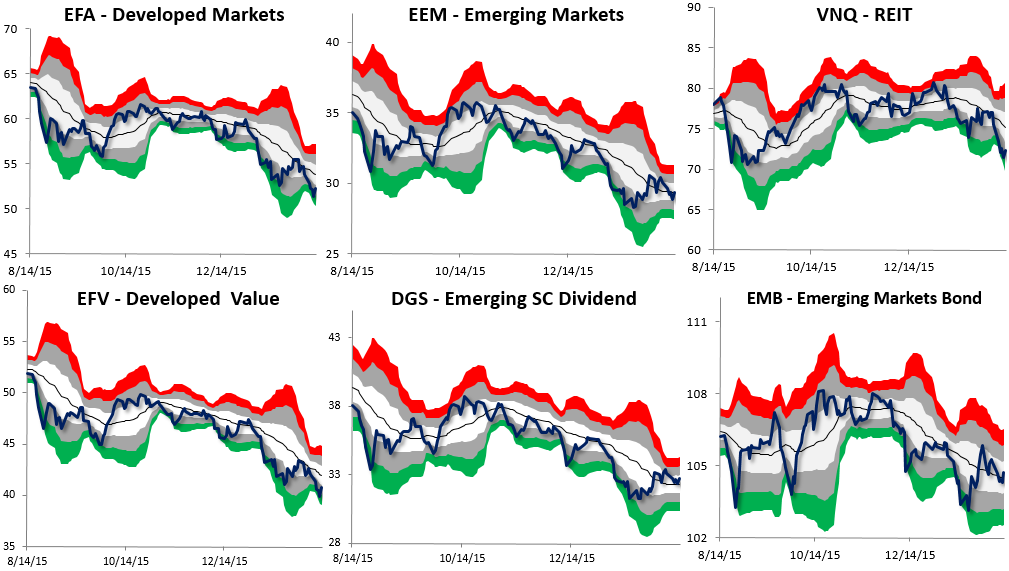
FedWatch tool. In fact, recently the Fed has been talking about the possibility of negative rates. The charts below show the normal trading ranges for various indices for the last six months. I have updated the charts to include all of the asset classes that I track. The red (or green) area indicates 2-3 standard deviations above (or below) the normal 21 day trading range. The gray area indicates 1-2 standard deviations above (or below) the normal 21 day trading range.
The Leading Indicator for International Developed Markets (EFA) decreased by 0.58% percentage points to 1.11%. The Leading Indicator for International Emerging Markets (EEM) is at 3.04%. On the chart below, you can click on the blue and red buttons to see the Leading Indicator growth rate and an ETF for each country.
All information, data and analysis provided by this website is for informational purposes only and is not a recommendation to buy or sell any security.   Click here for more details.

These charts have limitations.  Economic data is often revised after the fact.  The market is forward looking and anticipates future events.  The unexpected can and will happen.  The market is continually changing.  The conditions of the past are different from the present.  Past performance is not an indication of future performance.

Monday, February 8, 2016

International Leading Indicators - February 2016

The Leading Indicator for International Developed Markets (EFA) is at 1.26% and is 0.29% percentage points lower than last month. The Leading Indicator for International Emerging Markets (EEM) is at 3.11%.

The OECD released their Leading Indicators for most major countries today. 13 of the 20 countries in the Developed Markets had increasing Leading Indices. The Leading Indices increased for 7 out of 15 countries in the Emerging Markets. When available, I have averaged the indicators with the Conference Board's Leading indicators to create a composite for each country. I created Leading Indicators for International Developed Markets (EFA) and International Emerging Markets (EEM) by weighting each country's growth rate by the market share of each country's stocks in the respective funds. On the last chart below, you can click on the blue and red buttons to see the Leading Indicator growth rate and an ETF for various countries.

All information, data and analysis provided by this website is for informational purposes only and is not a recommendation to buy or sell any security.   Click here for more details.

Furthermore, these charts have limitations.  Economic data is often revised after the fact.  The market is forward looking and anticipates future events.  The unexpected can and will happen.  The market is continually changing.  The conditions of the past are different from the present.  Past performance is not an indication of future performance.

Sunday, February 7, 2016

Charting Last Week (2/1 - 2/5/16)

The Daily Leading Index increased by 0.08% percentage points to 0.74%. The Daily Coincident Index is at 2.37%. The Daily Leading Index page on the tab above is updated daily during the week.
Stocks ended the week lower after the Employment Report was released showing solid wage growth. The unemployment rate is down to 4.9%. The 10 year Treasury is at 1.84%, its lowest yield in a year. The charts below show the normal trading ranges for various indices for the last six months. I have updated the charts to include all of the asset classes that I track. The red (or green) area indicates 2-3 standard deviations above (or below) the normal 21 day trading range. The gray area indicates 1-2 standard deviations above (or below) the normal 21 day trading range.
There were not any updates to the International Leading Indices during the week. The Leading Indicator for International Developed Markets (EFA) is at 1.69%. The Leading Indicator for International Emerging Markets (EEM) is at 2.98%. On the chart below, you can click on the blue and red buttons to see the Leading Indicator growth rate and an ETF for each country.
All information, data and analysis provided by this website is for informational purposes only and is not a recommendation to buy or sell any security.   Click here for more details.

These charts have limitations.  Economic data is often revised after the fact.  The market is forward looking and anticipates future events.  The unexpected can and will happen.  The market is continually changing.  The conditions of the past are different from the present.  Past performance is not an indication of future performance.