Saturday, December 24, 2016

Charting Last Week (12/19 - 12/23/16)

The third estimate of third quarter GDP was released this Thursday coming in 3.51% growth rate over second quarter at an annualized rate or 1.65% over last year. This is very close to the North Star GDP Estimate for third quarter of 1.67% year over year. The North Star GDP Forecast for fourth quarter is a rate of 1.65% year over year.


Stock prices were mixed for the week while Bond prices were up. The Fed Funds futures are implying a 71.6% chance of another rate hike by June 2017 down from a 75.3% chance last week according CME Group's FedWatch tool. The charts below show the normal trading ranges for various indices for the last six months. The red (or green) area indicates 2-3 standard deviations above (or below) the normal 21 day trading range. The gray area indicates 1-2 standard deviations above (or below) the normal 21 day trading range.
  The Leading Indicator for International Developed Markets (EFA) decreased by 0.03% percentage points to 1.01%. The Leading Indicator for International Emerging Markets (EEM) is at 4.78%. On the chart below, you can click on the blue and red buttons to see the Leading Indicator growth rate and an ETF for each country.    
All information, data and analysis provided by this website is for informational purposes only and is not a recommendation to buy or sell any security. Click here for more details.

These charts have limitations. Economic data is often revised after the fact. The market is forward looking and anticipates future events. The unexpected can and will happen. The market is continually changing. The conditions of the past are different from the present. Past performance is not an indication of future performance.

Sunday, December 18, 2016

Charting Last Week (12/12 - 12/16/16)

I have revamped my Daily Leading Index and have changed it to the North Star GDP Forecast. It is now calibrated to forecast GDP (real US Gross Domestic Product). Official GDP is announced quarterly with a long lag. GDP for the fourth quarter (October-December) won't be announced until the end of January, 2017. The North Star GDP Forecast for the fourth quarter is 1.65% year over year growth which is slightly higher than last quarter's official 1.50% growth over the third quarter last year. A 1.65% growth rate is well below average when the economy is not in a recession, but it is in line with recent growth for the last year.

Below is a slideshow showing GDP going back to 1920 with explanations on how the GDP Estimate and Forecast work.
 

Here is a link to the old Daily Leading Index for comparison purposes: Daily Leading Index. The new GDP Forecast is more accurate and is more intuitive. Now it is easy to tell exactly what a 1.65% growth rate means.

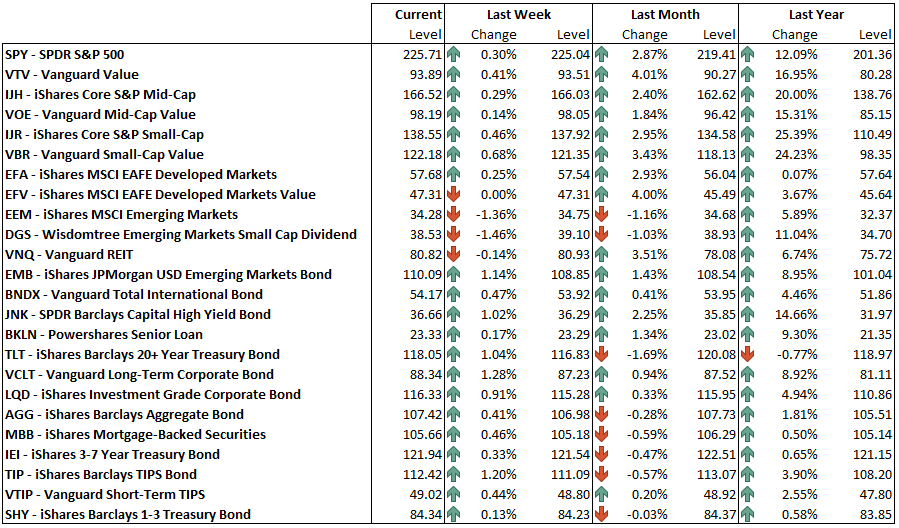
Stock prices were down for the week while Bond prices were mixed. The Fed raised rates by 0.25%, the first rate hike since last December. The Fed Funds futures are implying a 75.3% chance of another rate hike by June 2017 up from a 60.8% chance last week according CME Group's FedWatch tool. The charts below show the normal trading ranges for various indices for the last six months. The red (or green) area indicates 2-3 standard deviations above (or below) the normal 21 day trading range. The gray area indicates 1-2 standard deviations above (or below) the normal 21 day trading range.

The Leading Indicator for International Developed Markets (EFA) increased by 0.01% percentage points to 1.06%. The Leading Indicator for International Emerging Markets (EEM) is at 4.87%. On the chart below, you can click on the blue and red buttons to see the Leading Indicator growth rate and an ETF for each country.    
All information, data and analysis provided by this website is for informational purposes only and is not a recommendation to buy or sell any security. Click here for more details.

These charts have limitations. Economic data is often revised after the fact. The market is forward looking and anticipates future events. The unexpected can and will happen. The market is continually changing. The conditions of the past are different from the present. Past performance is not an indication of future performance.

Sunday, December 11, 2016

Charting Last Week (12/5 - 12/9/16)

The Daily Leading Index increased by 0.05% percentage points to 1.73%. The Daily Coincident Index is at 1.70%. The Daily Leading Index page on the tab above is updated daily during the week.
Stocks continued to rally this week setting new record highs in the process. The Fed Funds futures are implying a rate hike this month for the first time since last December followed by a second rate hike in June 2017 according CME Group's FedWatch tool. The charts below show the normal trading ranges for various indices for the last six months. The red (or green) area indicates 2-3 standard deviations above (or below) the normal 21 day trading range. The gray area indicates 1-2 standard deviations above (or below) the normal 21 day trading range.   The Leading Indicator for International Developed Markets (EFA) increased by 0.39% percentage points to 1.05%. The Leading Indicator for International Emerging Markets (EEM) is at 4.87%. On the chart below, you can click on the blue and red buttons to see the Leading Indicator growth rate and an ETF for each country.
 
All information, data and analysis provided by this website is for informational purposes only and is not a recommendation to buy or sell any security. Click here for more details.

These charts have limitations. Economic data is often revised after the fact. The market is forward looking and anticipates future events. The unexpected can and will happen. The market is continually changing. The conditions of the past are different from the present. Past performance is not an indication of future performance.

Friday, December 9, 2016

International Leading Indicators - December 2016

The Leading Indicator for International Developed Markets (EFA) is at 1.05% and is 0.48% percentage points higher than last month. The Leading Indicator for International Emerging Markets (EEM) decreased to 4.87%.

The OECD released their Leading Indicators for most major countries yesterday. 14 of the 20 countries in the Developed Markets had increasing Leading Indices. The Leading Indices decreased for 10 out of 15 countries in the Emerging Markets. When available, I have averaged the indicators with the Conference Board's Leading indicators to create a composite for each country. I created Leading Indicators for International Developed Markets (EFA) and International Emerging Markets (EEM) by weighting each country's growth rate by the market share of each country's stocks in the respective funds. On the last chart below, you can click on the blue and red buttons to see the Leading Indicator growth rate and an ETF for various countries.

All information, data and analysis provided by this website is for informational purposes only and is not a recommendation to buy or sell any security.   Click here for more details.

Furthermore, these charts have limitations.  Economic data is often revised after the fact.  The market is forward looking and anticipates future events.  The unexpected can and will happen.  The market is continually changing.  The conditions of the past are different from the present.  Past performance is not an indication of future performance.

Sunday, December 4, 2016

Charting Last Week (11/28 - 12/2/16)

The Daily Leading Index increased by 0.02% percentage points to 1.68%. The Daily Coincident Index is at 1.69%. The Daily Leading Index page on the tab above is updated daily during the week.
Stock and Bond prices were mostly down for the week. The Fed Funds futures are implying a rate hike this month followed by a second rate hike in July 2017 according CME Group's FedWatch tool. The charts below show the normal trading ranges for various indices for the last six months. The red (or green) area indicates 2-3 standard deviations above (or below) the normal 21 day trading range. The gray area indicates 1-2 standard deviations above (or below) the normal 21 day trading range.  
The Leading Indicator for International Developed Markets (EFA) was unchanged at 0.66%. The Leading Indicator for International Emerging Markets (EEM) decreased by 0.22% percentage points to 4.88%. On the chart below, you can click on the blue and red buttons to see the Leading Indicator growth rate and an ETF for each country.    
All information, data and analysis provided by this website is for informational purposes only and is not a recommendation to buy or sell any security. Click here for more details.

These charts have limitations. Economic data is often revised after the fact. The market is forward looking and anticipates future events. The unexpected can and will happen. The market is continually changing. The conditions of the past are different from the present. Past performance is not an indication of future performance.